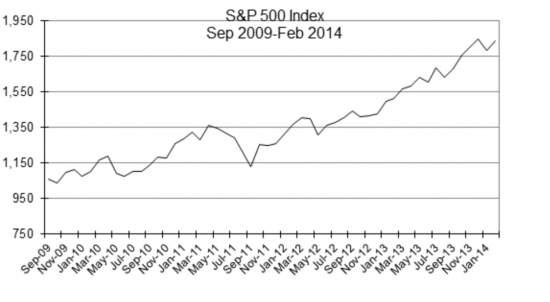
As one contemplates the strength of current and prospective macroeconomic conditions it is important to discount the feeling of goodwill on Wall St. engendered by a stock market which has proceeded up and to the right since the end of recessionary conditions. In fact, consider from September 30, 2009 to February 28, 2014 the S&P 500 Index has appreciated a whopping 77% as depicted on the following chart.

Certainly the primary driver has been an improving economic environment which has helped drive corporate earnings; however, the impact of Fed policy should not be ignored. A highly accommodative Fed has driven down interest rates to historically low levels prodding investors to take on more risk (i.e., equities) in search of better returns. It wasn’t that long ago a 6 month Treasury bill, with a current yield of .8%, yielded over 5%! In any case, those who had investable assets deployed in the stock market have reaped substantial economic benefits.
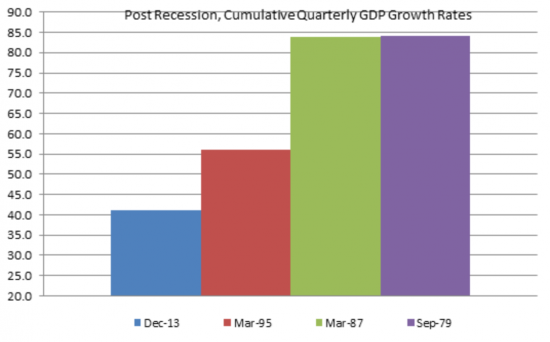
Conversely, Main St. denizens, whose economic health is more closely aligned with economic realities, have not experienced the same rebound. One reason for the marked tepidness of this recovery, seen in the following graph depicting cumulative GDP growth rates following the end of the prior four recessions, is the lackluster employment and wage growth.

Further, the labor landscape, while moving in a positive direction, evidenced by the unemployment rate falling from a peak of 10.1% to its current level of 6.6%, has not rebounded as robustly as one would hope. In fact, the aforementioned improvement has been exaggerated by a falling labor participation rate, which has dropped from approximately 67% in 2008 to its current level of 63%. I believe a purer measure of labor health can be found in the US Bureau of Labor’s “Employment, Hours, and Earnings from the Current Employment Statistics“ measure which remains .4% below its pre-recession peak in 2008.
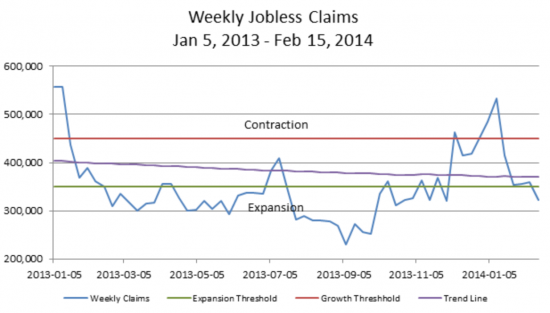
In any case, it is somewhat encouraging to note weekly jobless claims, presented in the following graph, have been on a recent downward trend and the most recent claims data (as of 2/15) is below 350,000, a threshold generally indicative of an expanding economy and improving labor market.

The Federal Reserve Bank of Philadelphia’s annual Survey of Professional Forecasters, surveying 45 economists, predicts real GDP growing a lackluster 2.8 percent in 2014 which unfortunately will not materially improve the labor environment. Consequently, we continue to encourage our Portfolio teams to conservatively manage their human and capital investments and are modeling potential new investments within the context of a modestly improving macroeconomic environment.
While feelings of goodwill on Wall St. engendered by the stock market may continue in the near term, our crystal ball will be seen through the eyes of Main St. and colored by the strength of the labor market evidenced by real wage and employment growth.