Let me preface this blog with the fact I am neither an economist nor a meteorologist, but based on certain macroeconomic indicators and discussions with our portfolio CEO’S, sense economic storm clouds looming on the horizon. My opinion flies in the face of our portfolio performance, which taken as a whole, has been strong to very strong for the past 18 months or so. Further, at our recently held annual Executive Summit we were treated to a presentation by a representative of the Federal Reserve Bank of Cleveland who voiced the Feds relative optimism concerning anticipated GDP growth. So why am I being a nervous Nellie (macroeconomic first term coined by John Maynard Keynes in 1942)? Let’s take a look at a few economic indicators.
The Purchasing Managers Index (PMI) has been over 50, reflective of a growing manufacturing economy, since August 2009 with its strongest readings coming in the last few months. However, the PMI index for May 2011 was 53.5, down substantially from the 60.4 registered in April. One month does not necessarily make a trend; however, the May PMI is notable since it was the lowest reading since September 2009.
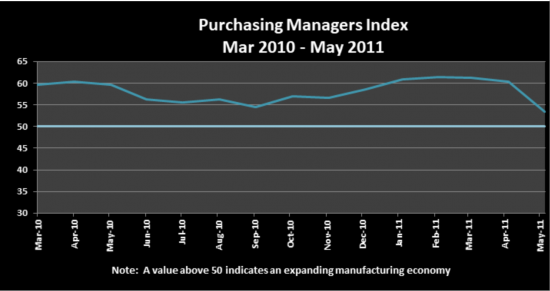
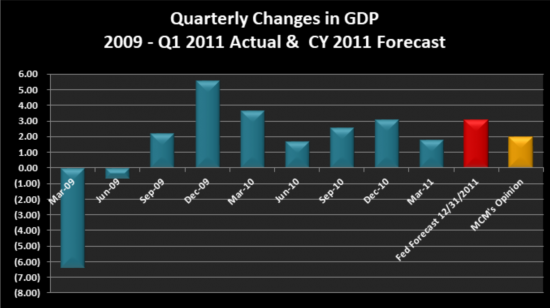
Not surprisingly, our manufacturing centric portfolio companies book to bill ratio has followed a similar pattern to the above chart with May order activity showing signs of softening. Further, In light of disappointing Q1 GDP of 1.8% the Federal Reserve downwardly revised their respective GDP forecasts from 3.5-4% to 2.5% -3.0% as detailed in the chart below. Our opinion is the Fed remains overly optimistic and 2011 GDP will come in closer to 2% as shown in the following slide we recently presented to our limited partners at our annual meeting.
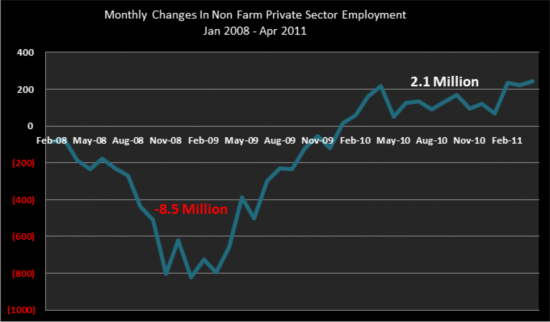
Our perspective is based on a sense the consumer continues to feel the effects of a weak labor market and diminished housing values and thus will not provide the economic fuel our economy needs to accelerate from its current pace. Even with recent net employment gains, unemployment remains stubbornly high, hovering around 9%. Remember, we lost a staggering 8.5 million jobs during the recession and have added only 2 million jobs since the recovery. While the recent employment expansion has been encouraging, it has not been sufficient enough to materially lower the unemployment rate and inspire consumer confidence. The following chart details monthly changes in labor since the start of the recession in January 2008.
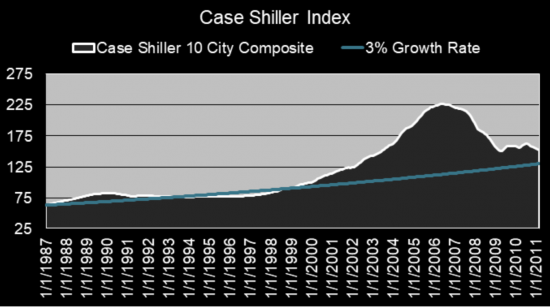
Typically, a consumer’s most valuable asset is the equity in their homes which, other than a temporary blip caused by the governments first time homeowner credit, has been in a downward spiral and approximately 32% off its June 2006 peak. Beginning with the January 1987 Case-Shiller 10 City Composite Index (CSI), the following graph plots an annual 3% growth rate (detailed by the blue line) against the CSI index through March 2011. Unfortunately, our analysis of the CSI suggests home values may continue to depreciate another 10%-15%.
With relatively low forecasted GDP, high unemployment rates, and continually downward pressure on the housing market it is unlikely the consumer can drive robust GDP growth. In fact, consumer spending rose by the smallest gain in past three months during April, perhaps a sign of decelerating spending as we keep a watchful eye on the storms progression. Consequently, we are advising our portfolio companies to carefully manage discretionary expenses and expect softer second half of 2011.
MCM Capital Partners is a Cleveland based MicroCap private equity fund investing in niche manufacturers, value added distributors and specialty service businesses. For more information on our private equity firm and investment principles, contact us today.